

 الفيزياء الكلاسيكية
 الكهربائية والمغناطيسية
 علم البصريات
 الفيزياء الحديثة
 النظرية النسبية
 الفيزياء النووية
 فيزياء الحالة الصلبة
 الليزر
 علم الفلك
 المجموعة الشمسية
 الطاقة البديلة
 الفيزياء والعلوم الأخرى
 مواضيع عامة في الفيزياء
|
Read More
Date: 24-5-2016
Date: 29-3-2017
Date: 7-11-2020
|
Plotting Radioactive Decay
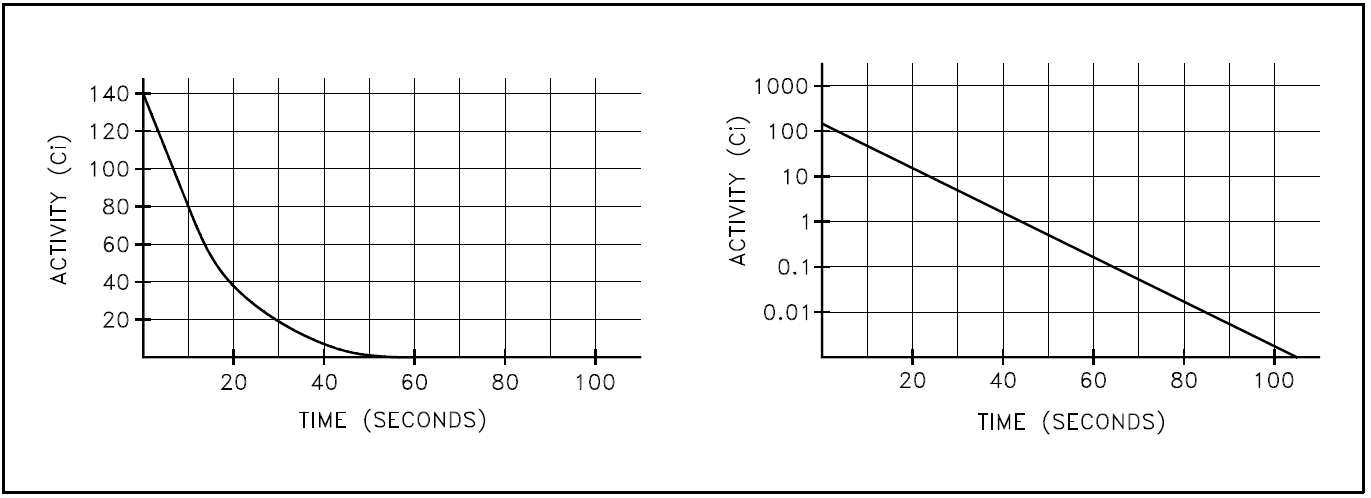
It is useful to plot the activity of a nuclide as it changes over time. Plots of this type can be used to determine when the activity will fall below a certain level. This plot is usually done showing activity on either a linear or a logarithmic scale. The decay of the activity of a single nuclide on a logarithmic scale will plot as a straight line because the decay is exponential.
Plotting the data points calculated above on both linear and semilog scales results in the graphs shown in Figure 1.

Figure 1: Linear and Semi-log Plots of Nitrogen-16 Decay
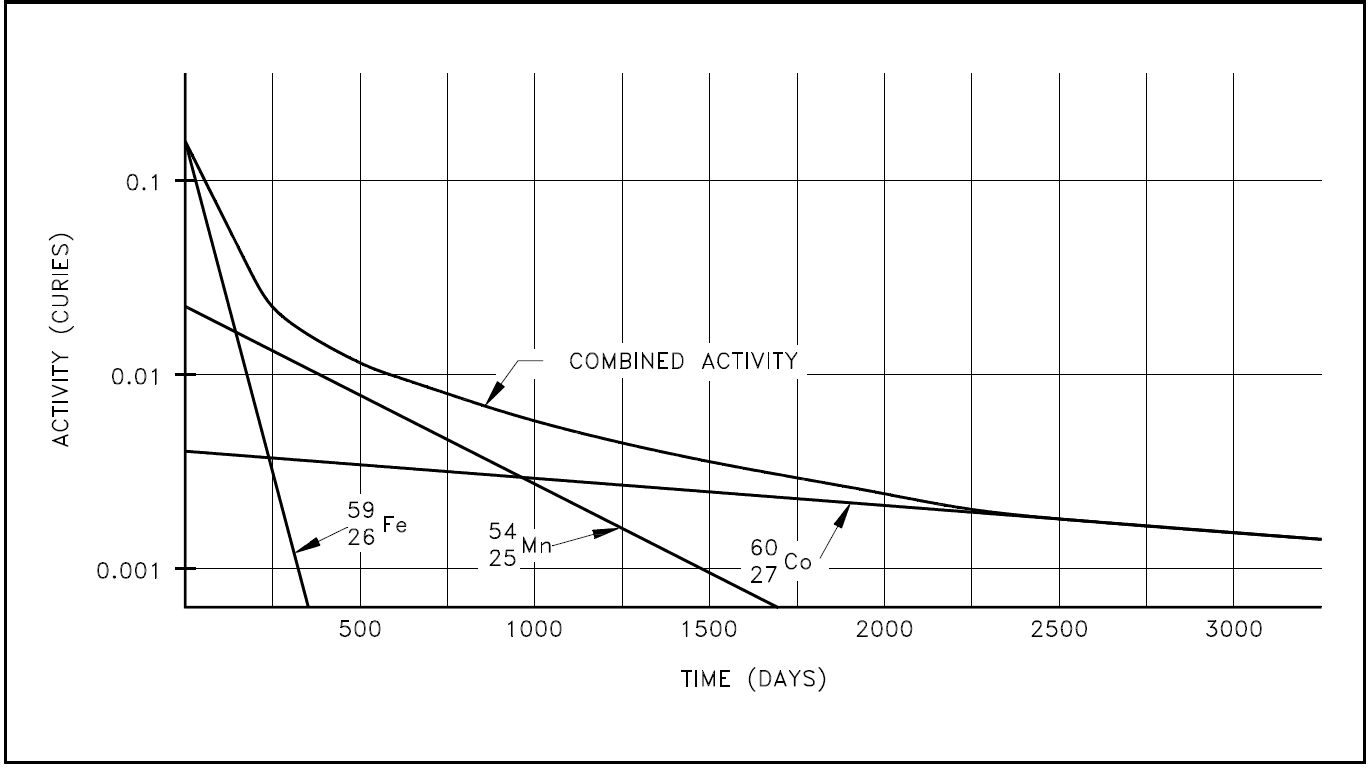
If a substance contains more than one radioactive nuclide, the total activity is the sum of the individual activities of each nuclide. As an example, consider a sample of material that contained 1 x 10⁶ atoms of iron-59 that has a half-life of 44.51 days (λ = 1.80 x 10⁻⁷ sec-1 ), 1 x 10⁶ atoms of manganese-54 that has a half-life of 312.2 days (λ = 2.57 x 10⁻⁸ sec-1), and 1 x 10⁶ atoms of cobalt-60 that has a half-life of 1925 days (λ = 4.17 x 10⁻⁹ sec-1). The initial activity of each of the nuclides would be the product of the number of atoms and the decay constant.

Plotting the manner in which the activities of each of the three nuclides decay over time demonstrates that initially the activity of the shortest-lived nuclide (iron-59) dominates the total activity, then manganese-54 dominates. After almost all of the iron and manganese have decayed away, the only contributor to activity will be the cobalt-60. A plot of this combined decay is shown in Figure 2.

Figure 2: Combined Decay of Iron-56, Manganese-54, and Cobalt-60


|
|
|
|
للعاملين في الليل.. حيلة صحية تجنبكم خطر هذا النوع من العمل
|
|
|
|
|
|
|
"ناسا" تحتفي برائد الفضاء السوفياتي يوري غاغارين
|
|
|
|
|
|
|
نحو شراكة وطنية متكاملة.. الأمين العام للعتبة الحسينية يبحث مع وكيل وزارة الخارجية آفاق التعاون المؤسسي
|
|
|