آخر المواضيع المضافة

 علم الكيمياء
الكيمياء التحليلية
الكيمياء الحياتية
الكيمياء العضوية
الكيمياء الفيزيائية
الكيمياء اللاعضوية
مواضيع اخرى في الكيمياء
الكيمياء الصناعية
علم الكيمياء
الكيمياء التحليلية
الكيمياء الحياتية
الكيمياء العضوية
الكيمياء الفيزيائية
الكيمياء اللاعضوية
مواضيع اخرى في الكيمياء
الكيمياء الصناعية | pH Titration Curves |


|
|
Read More
Date: 25-2-2018
Date: 2-5-2017
Date: 16-4-2017
|
pH Titration Curves
Acid solutions are often analyzed by titration with a solution of a strong base of known concentration; similarly, solutions of bases are analyzed by titration with a strong acid. In either case, the measured pH is plotted as a function of the titrant volume. Calculation of a pH titration curve is a particularly good introduction to acid-base equilibrium calculations since a variety of calculations are involved.
Example
Compute the pH vs. volume curve for the titration of 10.0 mL of 0.25 M HCl with 0.10 M NaOH.
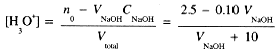
Since HCl and NaOH are completely dissociated in dilute solutions, and the reaction goes to completion, this is really a simple stoichiometry problem in which we convert the H3O+ concentration to pH. If the initial number of millimoles of HCl is

then, before complete neutralization [H3O+] after the addition of V mL of NaOH solution is
We set up a table for several volumes of NaOH added:
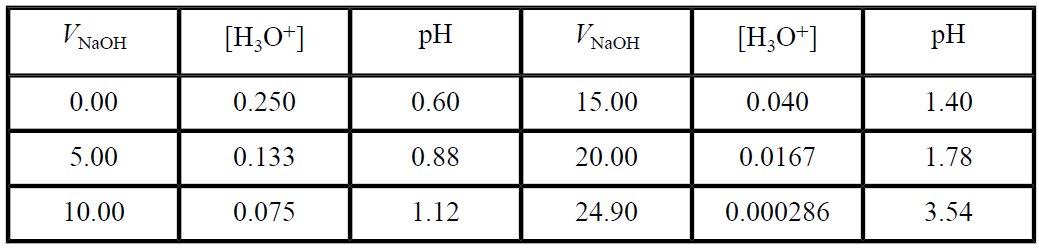
When we add exactly 25.00 mL of NaOH, all the H3O+ from the HCl has been consumed—the equivalence point. The solution then contains NaCl, and, since Na+ and Cl- are neither acidic or basic, the H3O+ concentration is due to water ionization alone and pH = 7.00. Beyond the equivalence point, the solution will contain excess OH-, the concentration of which is

and the pH is computed as pH = 14.00 - log[OH-]. Continuing the table for two more points:
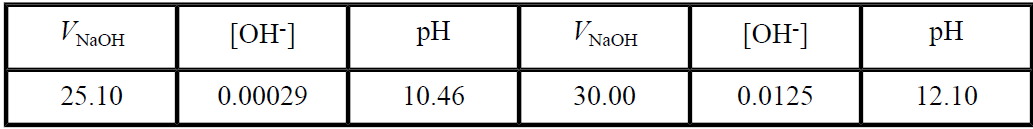
These points (and a few more) are plotted in Figure 1.1.
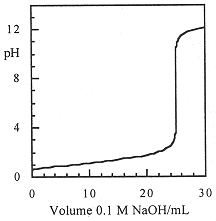
Figure 1.1. pH titration curve for titration of 10 mL of 0.25 M HCl with 0.10 M NaOH.


|
|
|
|
دخلت غرفة فنسيت ماذا تريد من داخلها.. خبير يفسر الحالة
|
|
|
|
|
|
|
ثورة طبية.. ابتكار أصغر جهاز لتنظيم ضربات القلب في العالم
|
|
|
|
|
|
|
سماحة السيد الصافي يؤكد ضرورة تعريف المجتمعات بأهمية مبادئ أهل البيت (عليهم السلام) في إيجاد حلول للمشاكل الاجتماعية
|
|
|