Interpretation of spectra and qualitative analysis
Spectrophotometric measurements with UV or visible radiation are useful for detecting compo nents that contain unsaturated groups or atoms such as sulfur or halogens. A drug, its impurity or a metabolite can also be transformed selectively so that the spectrum is shifted to the visible region and away from interference caused by another drug, formulation components, or biological substances, and thereby confer a further degree of specificity. However, specific identification of a compound can rarely be made on the basis of UV spectral evidence alone. Often, the spectrum serves as confirmatory evidence of identity, in support of other analytical data such as nuclear magnetic resonance (NMR), MS, IR. The general approach usually followed in qualitative applications is first to establish by independent means (e.g. chromatography) that the material consists substantially of one absorbing component. Spectra are then recorded in aqueous acidic, basic and ethanolic or methanolic solution. The wavelengths of the principal peaks and the corresponding absorptivity values are noted for each solvent system. The data are then compared with data for UV absorption maxima for standard substances tabulated in wavelength order. A number of compounds with absorbing proper ties similar to the test substance are identified (using a wavelength window of ±2 nm) as potential candidates for the unknown substance. One must be aware that, in general, the UV-vis spec trum of a metabolite of a component closely matches the spectrum of the component itself. Further evidence of substance identity can be deduced from the absorptivity ratios of peaks within a spectrum; moreover, as has already been discussed, the change in these ratios together with the shift in peak positions as the pH is changed can be diagnostic. If a drug molecule ionises reversibly (i.e. without degradation), the family of curves for a constant concentration in acidic and basic solvents displays one or more isosbestic points at characteristic wavelengths, at which the absorbance is constant at all values of pH.
Spectral shifts are among the most useful diagnostic features in drug molecules that possess ionisable groups. A marked bathochromic shift (or ‘red’ shift) to longer wavelengths in alkaline solution is observed not only for most of the phenolic drugs, such as the phenolic oestrogens, but also in the case of hydroxy pyridines, ketones, benzodiazepines, pyridones and nitro compounds. The bathochromic shift is often large (<10 nm) and accompanied by an increase in molar absorptivity (hyperchromic effect) and loss of any fine structure.
This effect has been exploited, for both qualitative and quantitative purposes, for the analysis of barbiturates. In acidic or neutral solution, bar biturates show little absorption above 230 nm (Fig. 1A), but in 0.05 Mboraxbuffer(pH9.2), ionisation yields an intense conjugated chromophore (Figs 1B and 2) with a well-defined maximum near 240 nm (A11=400–450). In sodium hydroxide solution (pH 13), a second stage of ionisation occurs (except in N substituted derivatives) to further extend the conjugation and give a peak maximum near 255 nm (Figs 1C and 2). However, solutions in alkali are unstable through ring-opening, so that measurements must be made rapidly.
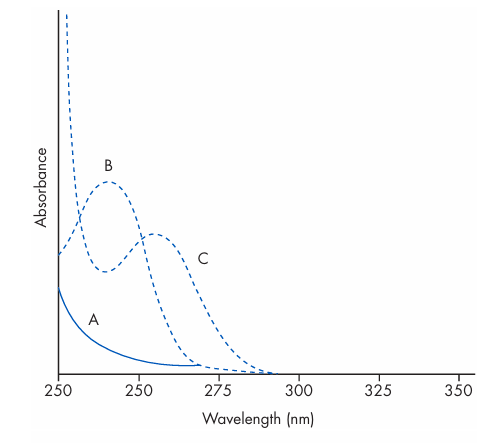
Figure 1 Effect of pH on the UV spectrum of phenobarbital. Curve A: nonionised barbiturate in 0.1 M hydrochloric acid. Curve B: mono-anion in 0.05 M borax buffer (pH 9.2). Curve C: di-anion in 0.5 M sodium hydroxide (pH 13).
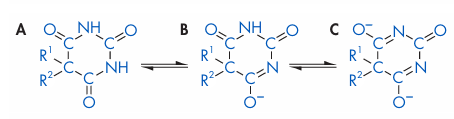
Figure 2 Dissociation of C5–substituted barbituric acids: (A) undissociated free acid; (B) mono-anion; (C) di-anion.
The hypochromic or ‘blue’ shift to shorter wave lengths is shown by aromatic amines in acid solution and is highly characteristic for many drugs. On acidification, the protonated quater nary ammonium group no longer participates in the chromophore, so that the spectrum is shifted to shorter wavelengths, sometimes by as much as 30 nm, with a sharp fall in absorptivity (hypochromic effect).
In addition to their use in characterising a chromophore, pH-induced shifts can also be exploited to shift a spectrum along the wave length scale to obtain an interference-free window in which to measure an ionisable species in a mixture.