Derivative spectrophotometry
In derivative spectrophotometry, the absorbance (A) of a sample is differentiated with respect to wavelength (k) to generate the first, second or higher-order derivatives:
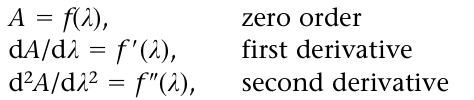
and so on. Derivative spectra often yield a characteristic profile, in which subtle changes of gradient and curvature in the normal (zero-order) spec trum are observed as distinctive bipolar features (Fig. 1). The first derivative of an absorption spectrum represents the gradient at all points of the spectrum and can be used to locate ‘hidden’ peaks, since dA/dλ 0 at peak maxima (Fig. 1). However, second- and higher even order derivatives are potentially more useful in analysis.
The even-order derivatives are bipolar functions of alternating sign at the centroid (i.e. negative for 2nd, positive for 4th, etc.), whose position coincides with that of the original peak maximum (Fig. 1). To this extent, even derivative spectra bear a similarity to the original spectrum, although the presence of satellite peaks that flank the centroid adds a degree of complexity to the derivative profile. A key feature is that the derivative centroid peak width of a Gaussian peak decreases to 53%, 41% and 34% of the original peak width, in the second, fourth and sixth orders, respectively. This feature can increase the resolution of overlapping peaks. However, the increasingly complex satellite patterns detract from resolution enhancement in higher derivative spectra.
Although transformation of a spectrum to its second- or higher-order derivative often yields a more highly characteristic profile than the zero-order spectrum, the intrinsic information content of the data is not increased; indeed, some data, such as constant ‘offset’ factors, are lost. The advantage of the derivative method is that it tends to emphasise subtle spectral features by presenting them in a new and visually more accessible way. The method is generally applicable in analytical chemistry and can be used equally for resolution enhancement of electrochemical, chromatographic or thermal analysis data. It is widely used in near infrared spectroscopy.
Derivative spectrophotometry has found application in clinical, forensic and biomedical analysis (Gill et al. 1982). In forensic toxicology, the suppression of the absorption from interfering substances by second-derivative spectrophotometry is well demonstrated in studies on amfetamine in a homogenised liver extract (Fig. 2). The characteristic absorption spec trum of amfetamine (Fig. 2C) is masked by interfering substances in a homogenised liver extract suspected to contain amfetamine (Fig. 2A). The second-derivative spectrum of the liver extract reveals a very similar spectrum to the second-derivative spectrum for amfetamine (Figs. 15.10B and D, respectively), clearly illustrating the use of this data treatment technique.
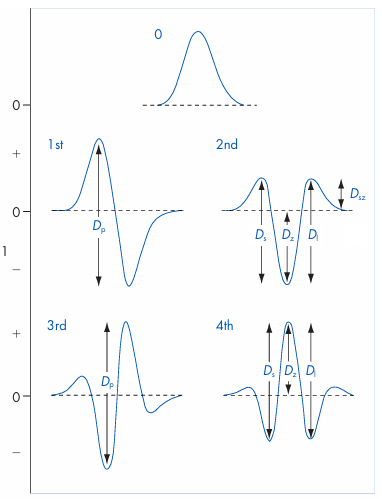
Figure 1 First to fourth derivatives of a Gaussian peak, and some graphical measures of derivative amplitude (D): Dp, peak-to-peak; Ds, peak-to-satellite at short wavelength; Dz, peak-to-derivative zero; Dl, peak-to-satel lite at long wavelength; Dsz, satellite peak-to-derivative zero.
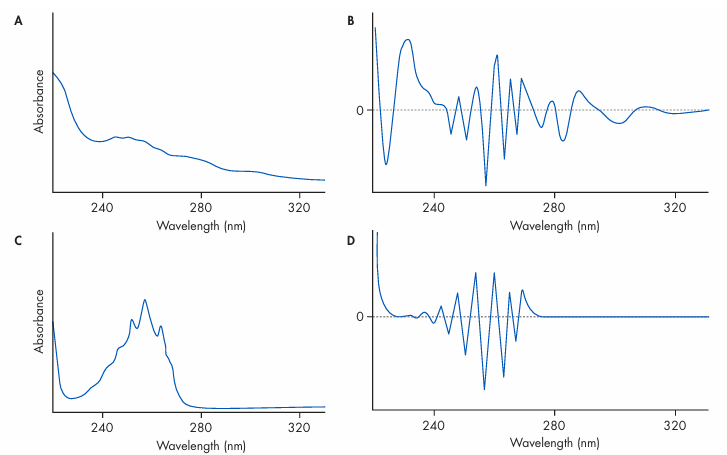
Figure 2 Detection of amfetamine in homogenised liver extract. Standard zero-order (A) and second-derivative (B) spectra of the liver extract, compared with the standard zero-order (C) and second-derivative (D) spectra of amfetamine. Solutions were in 0.1 M sulfuric acid. (From Gill et al. 1982.)