آخر المواضيع المضافة

 علم الكيمياء
الكيمياء التحليلية
الكيمياء الحياتية
الكيمياء العضوية
الكيمياء الفيزيائية
الكيمياء اللاعضوية
مواضيع اخرى في الكيمياء
الكيمياء الصناعية
علم الكيمياء
الكيمياء التحليلية
الكيمياء الحياتية
الكيمياء العضوية
الكيمياء الفيزيائية
الكيمياء اللاعضوية
مواضيع اخرى في الكيمياء
الكيمياء الصناعية | Properties of Gaussian Curves |


|
|
Read More
Date: 25-4-2017
Date: 24-4-2017
Date: 19-3-2016
|
Properties of Gaussian Curves
Figure 1.1 shows two Gaussian curves in which we plot the relative frequency y of various deviations from the mean versus the deviation from the mean.
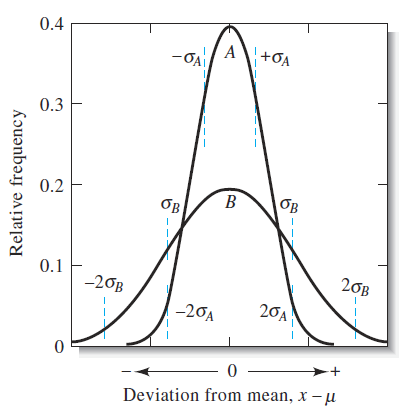
Figure 1.1 Normal error curves. The standard deviation for curve B is twice that for curve A, that is, σB = 2σA. In (a) the abscissa is the deviation from the mean (x – m) in the units of measurement.
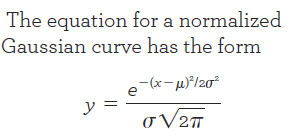
As shown in curves such as these can be described by an equation that contains just two parameters, the population mean μ and the population standard deviation σ.
The term parameter refers to quantities such as μ and σ that define a population or distribution. Data values such as x are variables. The term statistic refers to an estimate of a parameter that is made from a sample of data as discussed below. The sample mean and the sample standard deviation are examples of statistics that estimate parameters m and s respectively.


|
|
|
|
دخلت غرفة فنسيت ماذا تريد من داخلها.. خبير يفسر الحالة
|
|
|
|
|
|
|
ثورة طبية.. ابتكار أصغر جهاز لتنظيم ضربات القلب في العالم
|
|
|
|
|
|
|
سماحة السيد الصافي يؤكد ضرورة تعريف المجتمعات بأهمية مبادئ أهل البيت (عليهم السلام) في إيجاد حلول للمشاكل الاجتماعية
|
|
|