Instrument calibration
Data processing
All modern IR spectrometers are computer controlled, with measured data stored digitally. Computer control simplifies the process of running instruments and allows the easy imple mentation of standard operating procedures (SOPs). Computers readily allow changes between spectral units. In the early days, the IR spectrum of a compound was reported as percentage trans mittance as a function of wavelength in microns (μm). By the 1970s, percentage transmittance as a function of wavenumbers became the preferred form. The computer allows the ready conversion between transmittance and absorbance and between microns and wavenumbers. Presentation in terms of absorbance/wavenumber is likely to become increasingly familiar.
Computers readily allow accumulation of spectra. The spectrum of a weak sample can be scanned repeatedly to give an averaged spectrum with appreciably reduced noise and an improve ment in sensitivity. For example, there is little difference between the spectra of carbon disulfide and of benzocaine in carbon disulfide (Fig. 16.8), but with spectrum manipulation, a good spectrum of benzocaine is readily obtained (Fig. 16.9). The amount of benzocaine in the cell was approximately 4 lg but only about one quarter of this was in the IR beam. Each spectrum was recorded in less than 30 seconds. Digitised spectra can be corrected easily for solvent absorption or the presence of impurities. Various mathematical procedures can be applied, which include baseline corrections and levelling, smoothing, the determination of peak band widths, and the calculation of absorption band areas. Derivative spectra can be produced to help distinguish the contributions of overlapping components in an absorption band.
The identification and interpretation of spectra are assisted greatly by computer analysis. Spectra can be readily overlaid for comparison. The spectrum of a sample can be compared with a library of spectra (database) and a list of the compounds of best fit can be either displayed on a screen or printed out. The presence of certain functional groups can also be confirmed.
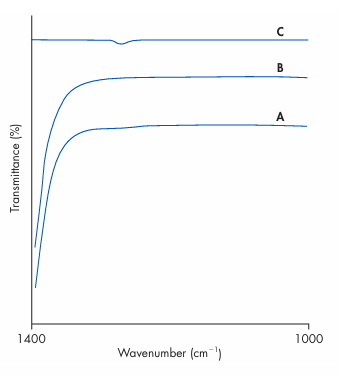
Figure 1 IR spectrum of benzocaine in carbon disulfide (A), carbon disulfide (B), and the difference spectrum (A-B) (C). (Courtesy of Perkin-Elmer Ltd.)
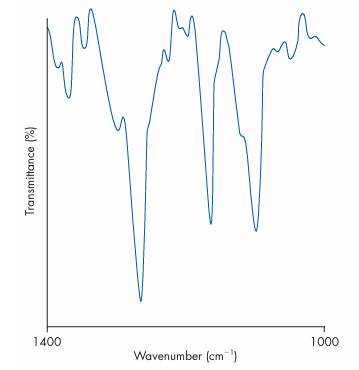
Figure 2 The difference spectrum of benzocaine shown in Fig. 16.8 (curve C) smoothed, corrected for baseline contribution and with percentage transmittance scale expanded 200 times. (Courtesy of Perkin-Elmer Ltd.)