آخر المواضيع المضافة

 الفيزياء الكلاسيكية
الكهربائية والمغناطيسية
علم البصريات
الفيزياء الحديثة
النظرية النسبية
الفيزياء النووية
فيزياء الحالة الصلبة
الليزر
علم الفلك
المجموعة الشمسية
الطاقة البديلة
الفيزياء والعلوم الأخرى
مواضيع عامة في الفيزياء
الفيزياء الكلاسيكية
الكهربائية والمغناطيسية
علم البصريات
الفيزياء الحديثة
النظرية النسبية
الفيزياء النووية
فيزياء الحالة الصلبة
الليزر
علم الفلك
المجموعة الشمسية
الطاقة البديلة
الفيزياء والعلوم الأخرى
مواضيع عامة في الفيزياء| Speaker Curves |


|
|
Read More
Date: 6-12-2020
Date: 1-1-2017
Date: 28-2-2016
|
Speaker Curves
When you buy a hi fi loudspeaker, you may be given a frequency response curve like that in Figure (1), for your new speaker. What the curve measures is the intensity of sound, at a standard distance, for a standard amount of power input at different frequencies. It is a fairly common industry standard to say that the frequency response is “flat” over the frequency range where the intensity does not fall more than 3 db from its average high value. In Figure (1), the response of that speaker, with the woofer turned on, is more or less “flat” from 62 Hz up to 30,000 Hz.
Why the 3 db cutoff was chosen, can be seen in the result of Exercise 3. There you saw that if you reduce the intensity of the sound by half, the loudness drops by 3 db. This is only 3/120 (or 1/36) of our total hearing range, not too disturbing a variation in what is supposed to be a flat response of the speaker.
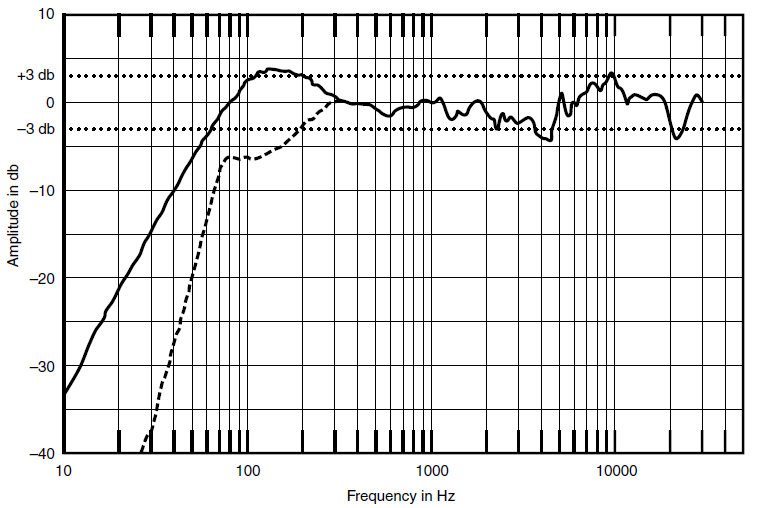
Figure 1: Speaker response curve from a recent audio magazine. The dashed line shows the response when the woofer is turned off. (We added the dotted lines at + and – 3 db.)


|
|
|
|
التوتر والسرطان.. علماء يحذرون من "صلة خطيرة"
|
|
|
|
|
|
|
مرآة السيارة: مدى دقة عكسها للصورة الصحيحة
|
|
|
|
|
|
|
نحو شراكة وطنية متكاملة.. الأمين العام للعتبة الحسينية يبحث مع وكيل وزارة الخارجية آفاق التعاون المؤسسي
|
|
|