آخر المواضيع المضافة

 الفيزياء الكلاسيكية
الكهربائية والمغناطيسية
علم البصريات
الفيزياء الحديثة
النظرية النسبية
الفيزياء النووية
فيزياء الحالة الصلبة
الليزر
علم الفلك
المجموعة الشمسية
الطاقة البديلة
الفيزياء والعلوم الأخرى
مواضيع عامة في الفيزياء
الفيزياء الكلاسيكية
الكهربائية والمغناطيسية
علم البصريات
الفيزياء الحديثة
النظرية النسبية
الفيزياء النووية
فيزياء الحالة الصلبة
الليزر
علم الفلك
المجموعة الشمسية
الطاقة البديلة
الفيزياء والعلوم الأخرى
مواضيع عامة في الفيزياء| Probability Interpretation |


|
|
Read More
Date: 28-3-2017
Date: 26-3-2017
Date: 5-4-2017
|
Probability Interpretation
We have interpreted Figure (1) as representing the spread in energies of the photons in a 2 femtosecond red laser pulse. What if the pulse consisted of only a single photon? Then how do we interpret this spread in energies? The answer is that we use a probability interpretation. The photon in the pulse has different probabilities of having different energies.
In our discussion of light waves, we saw that the energy density in a light wave was proportional to the square of the amplitude of the wave. This is reasonable because while the amplitude of a wave can be positive or negative, the square of the amplitude, which we call the intensity is always positive. Probabilities, like energy densities, also have to be positive, thus we should associate the probability of a photon as having a given frequency with the intensity or square of the amplitude of the wave of that frequency.
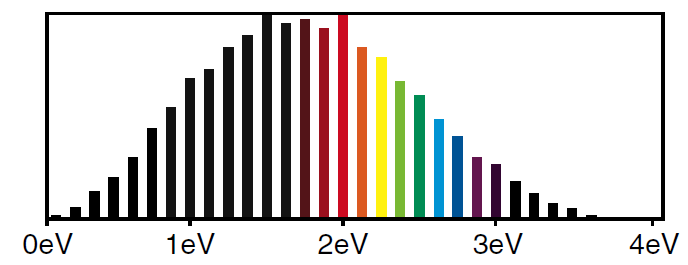
Figure 1: Photon energies in single wavelength pulse of a red laser beam.
In Figure (2) we show the intensities (square of the amplitudes) of the harmonics that make up the single wavelength pulse. (This is plotted automatically by MacScope when we click on the button labeled Φ .)
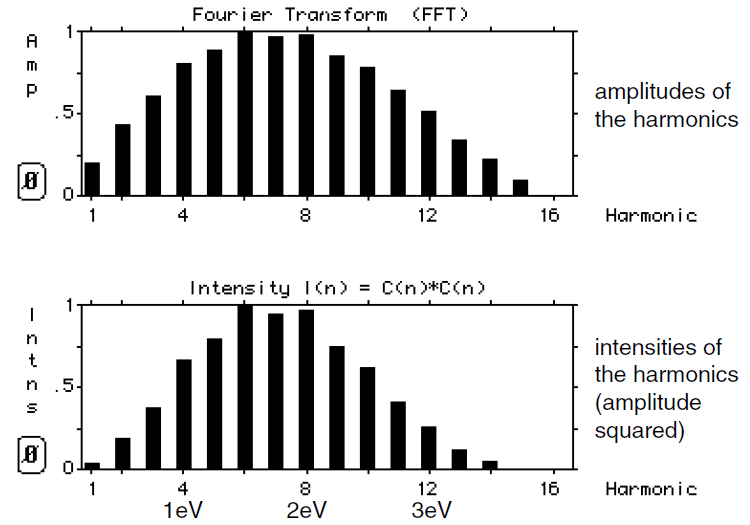
Figure 2: Intensities of the harmonics are proportional to the square of the amplitudes.
We see that squaring the amplitudes narrows the spread. Figure (2) has the following interpretation when applied to pulses containing a single photon. If we measure the energy of the photon, we are most likely to get an answer close to 2 eV but there is a reasonable probability of getting an answer lower than 1 eV or even higher than 3 eV. The heights of the bars tell us the relative probability of measuring that energy for the photon.

|
|
|
|
4 أسباب تجعلك تضيف الزنجبيل إلى طعامك.. تعرف عليها
|
|
|
|
|
|
|
أكبر محطة للطاقة الكهرومائية في بريطانيا تستعد للانطلاق
|
|
|
|
|
|
|
أصواتٌ قرآنية واعدة .. أكثر من 80 برعماً يشارك في المحفل القرآني الرمضاني بالصحن الحيدري الشريف
|
|
|