تاريخ الفيزياء

علماء الفيزياء


الفيزياء الكلاسيكية

الميكانيك

الديناميكا الحرارية


الكهربائية والمغناطيسية

الكهربائية

المغناطيسية

الكهرومغناطيسية


علم البصريات

تاريخ علم البصريات

الضوء

مواضيع عامة في علم البصريات

الصوت


الفيزياء الحديثة


النظرية النسبية

النظرية النسبية الخاصة

النظرية النسبية العامة

مواضيع عامة في النظرية النسبية

ميكانيكا الكم

الفيزياء الذرية

الفيزياء الجزيئية


الفيزياء النووية

مواضيع عامة في الفيزياء النووية

النشاط الاشعاعي


فيزياء الحالة الصلبة

الموصلات

أشباه الموصلات

العوازل

مواضيع عامة في الفيزياء الصلبة

فيزياء الجوامد


الليزر

أنواع الليزر

بعض تطبيقات الليزر

مواضيع عامة في الليزر


علم الفلك

تاريخ وعلماء علم الفلك

الثقوب السوداء


المجموعة الشمسية

الشمس

كوكب عطارد

كوكب الزهرة

كوكب الأرض

كوكب المريخ

كوكب المشتري

كوكب زحل

كوكب أورانوس

كوكب نبتون

كوكب بلوتو

القمر

كواكب ومواضيع اخرى

مواضيع عامة في علم الفلك

النجوم

البلازما

الألكترونيات

خواص المادة


الطاقة البديلة

الطاقة الشمسية

مواضيع عامة في الطاقة البديلة

المد والجزر

فيزياء الجسيمات


الفيزياء والعلوم الأخرى

الفيزياء الكيميائية

الفيزياء الرياضية

الفيزياء الحيوية

الفيزياء العامة


مواضيع عامة في الفيزياء

تجارب فيزيائية

مصطلحات وتعاريف فيزيائية

وحدات القياس الفيزيائية

طرائف الفيزياء

مواضيع اخرى
FOURIER ANALYSIS
المؤلف:
E. R. Huggins
المصدر:
Physics 2000
الجزء والصفحة:
434
4-12-2020
2350
FOURIER ANALYSIS
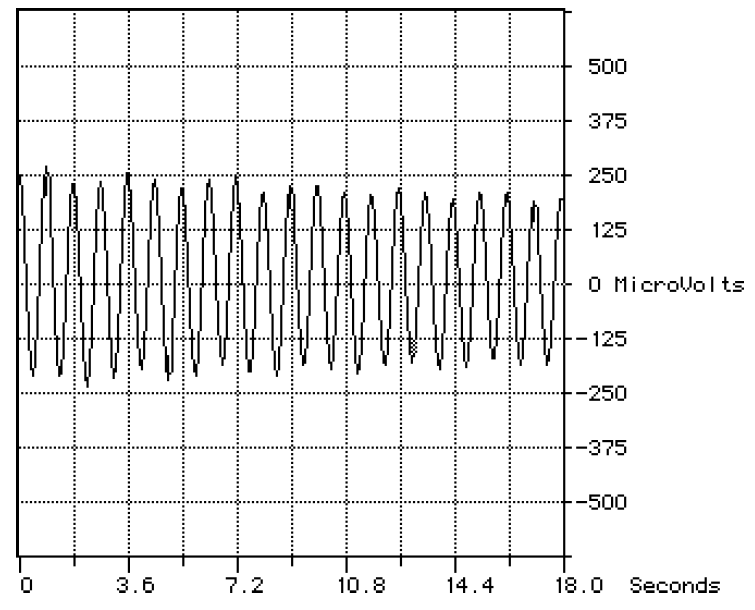
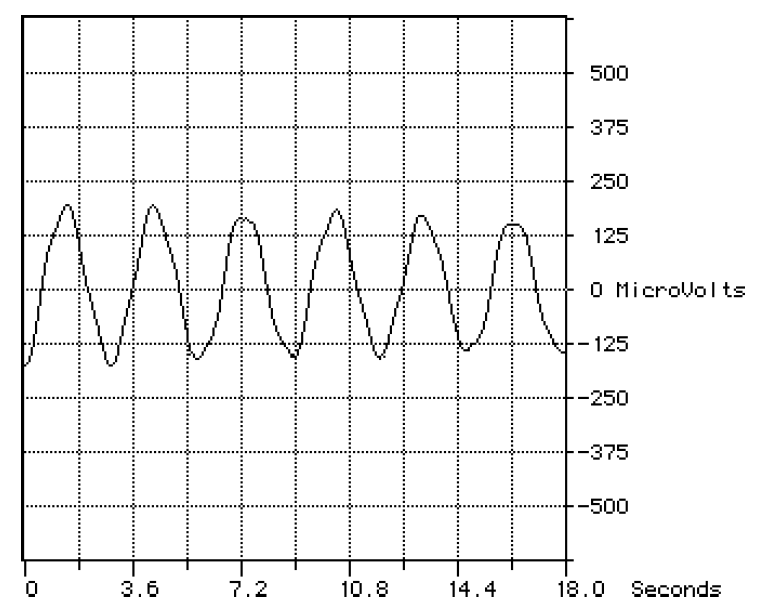
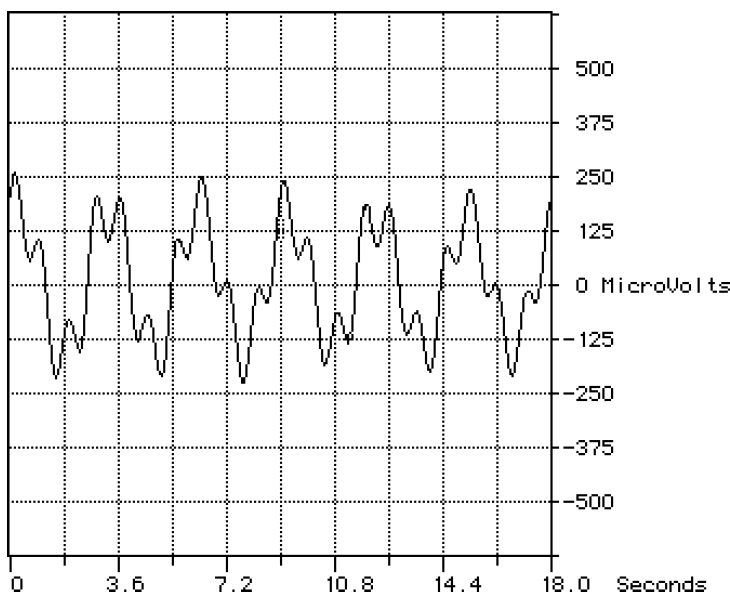
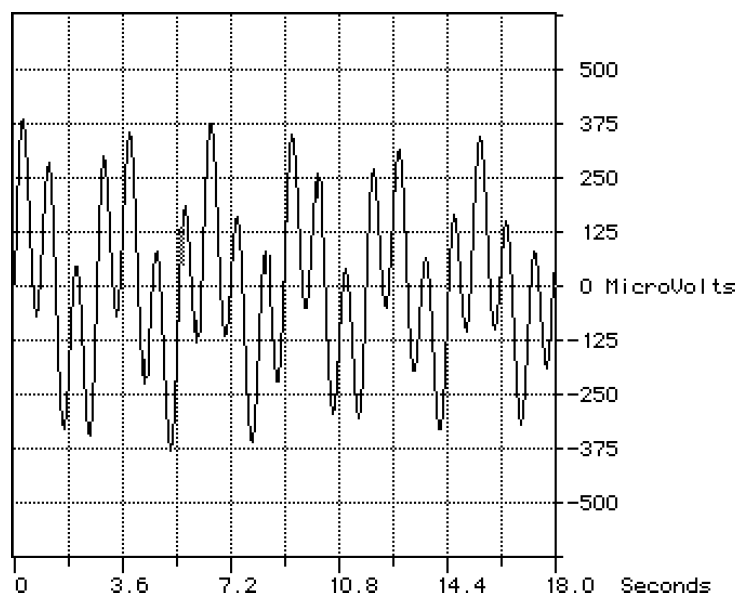
Is essentially a mathematical prism that allows us to decompose a complex waveform into its constituent pure frequencies, much as a prism separates sunlight into beams of pure color or wavelength. We have just studied the motion of coupled air carts, which gave us an explicit example of a relatively complex waveform to analyze. While the two carts can oscillate with simple sinusoidal motion in the vibrational and sloshing modes of Figures (1) and (2), in general we get complex patterns like those in Figures (3) and (4). What we will see is that, by using Fourier analysis, the waveforms in Figures (3) and (4) are not so complex after all.

Figure 1: Vibrational mode of oscillation of the coupled aircarts. The voltage signal is proportional to the velocity of the cart that has the coil on top.

Figure 2: A pure sloshing mode is harder to get. Here we came close, but it is not quite a pure sine wave.
The MacScope program was designed to make it easy to perform Fourier analysis on experimental data. The MacScope tutorial gives you considerable practice using MacScope for Fourier analysis. What we will do here is discuss a few examples to see how the program, and how Fourier analysis works. We will then apply Fourier analysis to the curves of Figures (3) and (4) to see what we can learn. But first we will see how MacScope handles the analysis of more standard curves like a sine wave or square wave.

Figure 3: Complex motion of the coupled air carts.

Figure 4: Another example of the complex motion of the coupled air carts.
 الاكثر قراءة في الصوت
 اخر الاخبار
اخبار العتبة العباسية المقدسة

الآخبار الصحية


 قسم الشؤون الفكرية يصدر كتاباً يوثق تاريخ السدانة في العتبة العباسية المقدسة
 "المهمة".. إصدار قصصي يوثّق القصص الفائزة في مسابقة فتوى الدفاع المقدسة للقصة القصيرة
 (نوافذ).. إصدار أدبي يوثق القصص الفائزة في مسابقة الإمام العسكري (عليه السلام)


