
آخر المواضيع المضافة

 علم الكيمياء
الكيمياء التحليلية
الكيمياء الحياتية
الكيمياء العضوية
الكيمياء الفيزيائية
الكيمياء اللاعضوية
مواضيع اخرى في الكيمياء
الكيمياء الصناعية
علم الكيمياء
الكيمياء التحليلية
الكيمياء الحياتية
الكيمياء العضوية
الكيمياء الفيزيائية
الكيمياء اللاعضوية
مواضيع اخرى في الكيمياء
الكيمياء الصناعية | Control Plots |


|
|
Read More
Date: 6-12-2015
Date: 16-1-2016
Date: 16-2-2017
|
Control Plots
There are two commonly used control plots, either Levey Jennings or Westgard and both inform the service of the accuracy of the test over time. Excellent online resources for both these plots exist, accessible by any good search engine, and will provide further reading. They usually have a range of the mean plus or minus 3SD which on normally distributed data is 99.7% confidence. Test results for a patient sample which fall outside of this range are to be considered for rejection. The plots also inform the test is over or under reporting results over time.
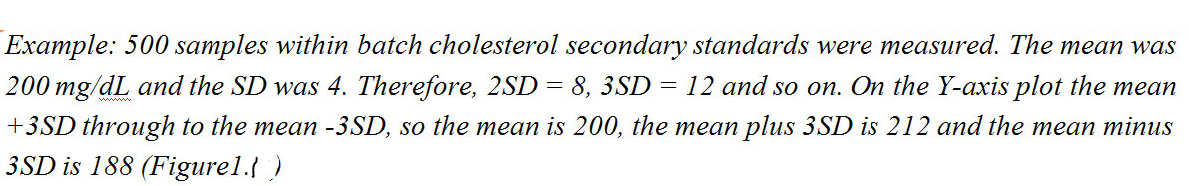
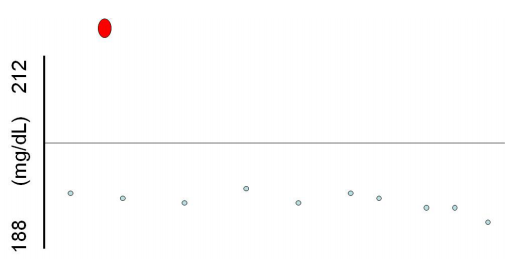
Figure 1.1: Example of a control plot. On the Y-axis is the mean plus and minus 3 SD determined by the within batch, on the X-axis is the mean value for each between batch test. The red dot is a mean value which is outside the 3SD range and may be considered for rejection. Each blue dot (x10) is the mean value of the between batch over 10 days, a blue dot per day, this shows that this test is under reporting. Think about what a test that over reported may look like?


|
|
|
|
لخفض ضغط الدم.. دراسة تحدد "تمارين مهمة"
|
|
|
|
|
|
|
طال انتظارها.. ميزة جديدة من "واتساب" تعزز الخصوصية
|
|
|
|
|
|
|
عوائل الشهداء: العتبة العباسية المقدسة سبّاقة في استذكار شهداء العراق عبر فعالياتها وأنشطتها المختلفة
|
|
|