
آخر المواضيع المضافة

 تاريخ الرياضيات
الرياضيات في الحضارات المختلفة
الرياضيات المتقطعة
الجبر
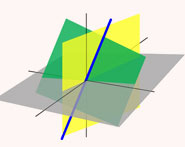
الهندسة
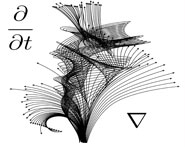
المعادلات التفاضلية و التكاملية
التحليل
علماء الرياضيات
تاريخ الرياضيات
الرياضيات في الحضارات المختلفة
الرياضيات المتقطعة
الجبر
الهندسة
المعادلات التفاضلية و التكاملية
التحليل
علماء الرياضيات | Dot Plot |


|
|
Read More
Date: 23-3-2021
Date: 20-4-2021
Date: 22-2-2021
|
A dot plot, also called a dot chart, is a type of simple histogram-like chart used in statistics for relatively small data sets where values fall into a number of discrete bins. To draw a dot plot, count the number of data points falling in each bin and draw a stack of dots that number high for each bin. The illustration above shows such a plot for a random sample of 100 integers chosen between 1 and 25 inclusively.
Simple code for drawing a dot plot in the Wolfram Language with some appropriate labeling of bin heights can be given as
DotPlot[data_] := Module[{m = Tally[Sort[data]]},
  ListPlot[Flatten[Table[{#1, n}, {n, #2}]& @@@ m, 1],
   Ticks -> {Automatic, Range[0, Max[m[[All, 2]]]]}]
]
REFERENCES:
Cleveland, W. S. Visualizing Data. Hobart Press, 1993.
Wilkinson, L. "Dot Plots." Amer. Stat. 53, 276-281, 1999.
Tatsilo's Dot Plot. https://data.vanderbilt.edu/~graywh/dotplot/.

|
|
|
|
4 أسباب تجعلك تضيف الزنجبيل إلى طعامك.. تعرف عليها
|
|
|
|
|
|
|
أكبر محطة للطاقة الكهرومائية في بريطانيا تستعد للانطلاق
|
|
|
|
|
|
|
العتبة العباسية المقدسة تبحث مع العتبة الحسينية المقدسة التنسيق المشترك لإقامة حفل تخرج طلبة الجامعات
|
|
|