

 علم الكيمياء
 الكيمياء التحليلية
 الكيمياء الحياتية
 الكيمياء العضوية
 الكيمياء الفيزيائية
 الكيمياء اللاعضوية
 مواضيع اخرى في الكيمياء
 الكيمياء الصناعية
 |
Read More
Date: 22-2-2020
Date: 6-8-2019
Date: 3-1-2020
|
To understand why some compounds are colored and others are not, and to determine the relationship of conjugation to color, we must make accurate measurements of light absorption at different wavelengths in and near the visible part of the spectrum. Commercial optical spectrometers enable such experiments to be conducted with ease, and usually survey both the near ultraviolet and visible portions of the spectrum.
The visible region of the spectrum comprises photon energies of 36 to 72 kcal/mole, and the near ultraviolet region, out to 200 nm, extends this energy range to 143 kcal/mole. Ultraviolet radiation having wavelengths less than 200 nm is difficult to handle, and is seldom used as a routine tool for structural analysis.

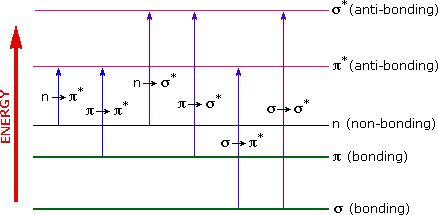
The energies noted above are sufficient to promote or excite a molecular electron to a higher energy orbital. Consequently, absorption spectroscopy carried out in this region is sometimes called "electronic spectroscopy". A diagram showing the various kinds of electronic excitation that may occur in organic molecules is shown on the left. Of the six transitions outlined, only the two lowest energy ones (left-most, colored blue) are achieved by the energies available in the 200 to 800 nm spectrum. As a rule, energetically favored electron promotion will be from the highest occupied molecular orbital (HOMO) to the lowest unoccupied molecular orbital (LUMO), and the resulting species is called an excited state.
When sample molecules are exposed to light having an energy that matches a possible electronic transition within the molecule, some of the light energy will be absorbed as the electron is promoted to a higher energy orbital. An optical spectrometer records the wavelengths at which absorption occurs, together with the degree of absorption at each wavelength. The resulting spectrum is presented as a graph of absorbance (A) versus wavelength, as in the isoprene spectrum shown below. Since isoprene is colorless, it does not absorb in the visible part of the spectrum and this region is not displayed on the graph. Absorbance usually ranges from 0 (no absorption) to 2 (99% absorption), and is precisely defined in context with spectrometer operation.


|
|
|
|
تفوقت في الاختبار على الجميع.. فاكهة "خارقة" في عالم التغذية
|
|
|
|
|
|
|
أمين عام أوبك: النفط الخام والغاز الطبيعي "هبة من الله"
|
|
|
|
|
|
|
قسم شؤون المعارف ينظم دورة عن آليات عمل الفهارس الفنية للموسوعات والكتب لملاكاته
|
|
|