Grammar
Tenses
Present

Present Simple
Present Continuous
Present Perfect
Present Perfect Continuous
Past
Past Simple
Past Continuous
Past Perfect
Past Perfect Continuous
Future
Future Simple
Future Continuous
Future Perfect
Future Perfect Continuous
Parts Of Speech
Nouns
Countable and uncountable nouns
Verbal nouns
Singular and Plural nouns
Proper nouns
Nouns gender
Nouns definition
Concrete nouns
Abstract nouns
Common nouns
Collective nouns
Definition Of Nouns
Animate and Inanimate nouns
Nouns
Verbs
Stative and dynamic verbs
Finite and nonfinite verbs
To be verbs
Transitive and intransitive verbs
Auxiliary verbs
Modal verbs
Regular and irregular verbs
Action verbs
Verbs
Adverbs
Relative adverbs
Interrogative adverbs
Adverbs of time
Adverbs of place
Adverbs of reason
Adverbs of quantity
Adverbs of manner
Adverbs of frequency
Adverbs of affirmation
Adverbs
Adjectives
Quantitative adjective
Proper adjective
Possessive adjective
Numeral adjective
Interrogative adjective
Distributive adjective
Descriptive adjective
Demonstrative adjective
Pronouns
Subject pronoun
Relative pronoun
Reflexive pronoun
Reciprocal pronoun
Possessive pronoun
Personal pronoun
Interrogative pronoun
Indefinite pronoun
Emphatic pronoun
Distributive pronoun
Demonstrative pronoun
Pronouns
Pre Position
Preposition by function
Time preposition
Reason preposition
Possession preposition
Place preposition
Phrases preposition
Origin preposition
Measure preposition
Direction preposition
Contrast preposition
Agent preposition
Preposition by construction
Simple preposition
Phrase preposition
Double preposition
Compound preposition
prepositions
Conjunctions
Subordinating conjunction
Correlative conjunction
Coordinating conjunction
Conjunctive adverbs
conjunctions
Interjections
Express calling interjection
Phrases
Sentences
Clauses
Part of Speech
Grammar Rules
Passive and Active
Preference
Requests and offers
wishes
Be used to
Some and any
Could have done
Describing people
Giving advices
Possession
Comparative and superlative
Giving Reason
Making Suggestions
Apologizing
Forming questions
Since and for
Directions
Obligation
Adverbials
invitation
Articles
Imaginary condition
Zero conditional
First conditional
Second conditional
Third conditional
Reported speech
Demonstratives
Determiners
Direct and Indirect speech
Linguistics
Phonetics
Phonology
Linguistics fields
Syntax
Morphology
Semantics
pragmatics
History
Writing
Grammar
Phonetics and Phonology
Semiotics
Reading Comprehension
Elementary
Intermediate
Advanced
Teaching Methods
Teaching Strategies
Assessment

DESIGNING EXHIBIT SLIDES
 المؤلف:
BARBARA MINTO
المؤلف:
BARBARA MINTO
 المصدر:
THE MINTO PYRAMID PRINCIPLE
المصدر:
THE MINTO PYRAMID PRINCIPLE
 الجزء والصفحة:
196-11
الجزء والصفحة:
196-11
 2024-10-01
 1304
1304


+
-
20
DESIGNING EXHIBIT SLIDES
Text slides use a familiar medium of communication-words. But exhibit slides (charts, graphs, tables, and diagrams) employ a wholly different means of communication-visual relationships. They enable you to present to your audience masses of data and complex relationships that you cannot convey as effectively by words alone.
In general, exhibit slides should convey their message as simply and readably as possible. The viewer will not have the opportunity to study them and figure out what the various elements mean. And if the chart or graph is too complicated, detailed, or cluttered, you will waste precious time explaining it rather than discussing its message. This does not rule out the occasional, more complex diagram or chart that becomes clear as the speaker develops the ideas. But you would not want more than one or two of these to a presentation.
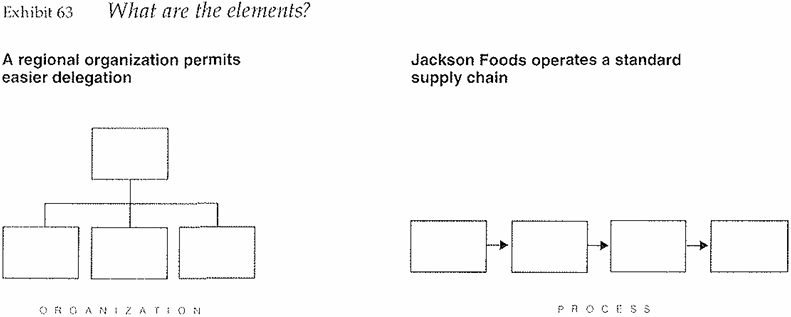
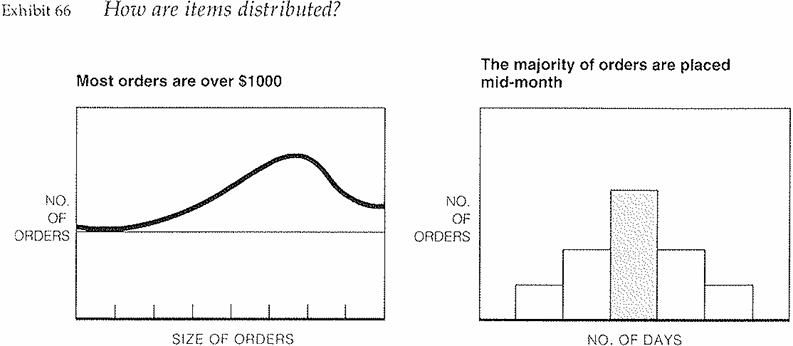
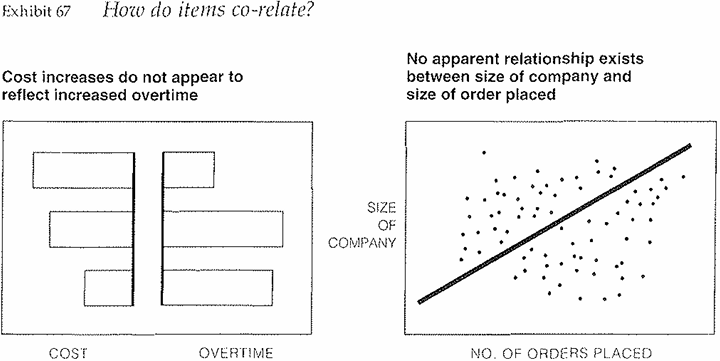
Exhibit slides generally show the parts of a structure or process, or display data in a visual way, using charts formed into pies, bars, columns, curves, or dots. The diagrams and charts tend to be used to answer five kinds of question (Exhibits 63-67):
- What are the elements?
- What has/how has it changed?
- How do amounts compare
- How are items distributed?
to the whole?
to each other?
over time?
- How do items co-relate?
The trick is to decide the question you want the exhibit to answer, state the answer as the title to the chart, and then choose the chart form most appropriate to showing that point.
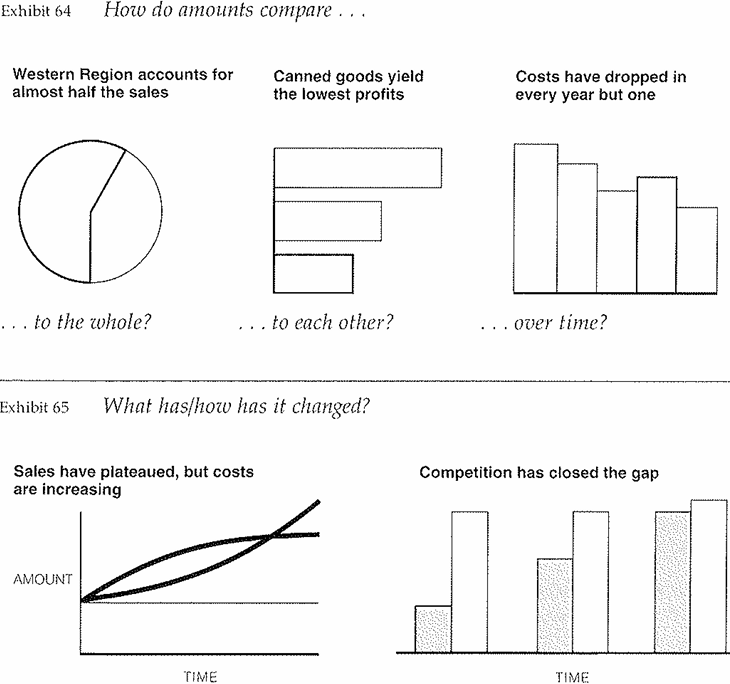
Do make sure that the title to a chart or diagram directly conveys its message, either as a full sentence or as a phrase that contains a verb. Doing so allows you to check that the visual impression the chart gives the viewer is consistent with the message you wish to convey. "Share of profits by region," contains much less information than "Western Region accounts for almost half the profits."
Stating the point of the chart also minimizes the possibility of confusion. Different viewers, left to themselves, will focus on different relationships depending upon their point of view, their background, or their interest. This way you focus them instantly on the aspect of the data you wish to emphasize.
 الاكثر قراءة في Writing
 اخر الاخبار
اخبار العتبة العباسية المقدسة

الآخبار الصحية


مواضيع ذات صلة
 قسم الشؤون الفكرية يصدر كتاباً يوثق تاريخ السدانة في العتبة العباسية المقدسة
 "المهمة".. إصدار قصصي يوثّق القصص الفائزة في مسابقة فتوى الدفاع المقدسة للقصة القصيرة
 (نوافذ).. إصدار أدبي يوثق القصص الفائزة في مسابقة الإمام العسكري (عليه السلام)