
Crystalline Solids: Band Theory
 المؤلف:
LibreTexts Project
المؤلف:
LibreTexts Project
 المصدر:
................
المصدر:
................
 الجزء والصفحة:
.................
الجزء والصفحة:
.................
 14-5-2020
 1818
1818
Crystalline Solids: Band Theory
Band Theory was developed with some help from the knowledge gained during the quantum revolution in science. In 1928, Felix Bloch had the idea to take the quantum theory and apply it to solids. In 1927, Walter Heitler and Fritz London discovered bands- very closely spaced orbitals with not much difference in energy.
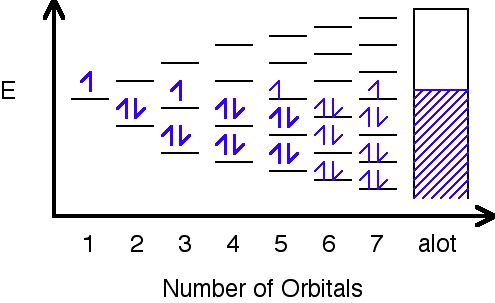
In this image, orbitals are represented by the black horizontal lines, and they are being filled with an increasing number of electrons as their amount increases. Eventually, as more orbitals are added, the space in between them decreases to hardly anything, and as a result, a band is formed where the orbitals have been filled.
Different metals will produce different combinations of filled and half filled bands.
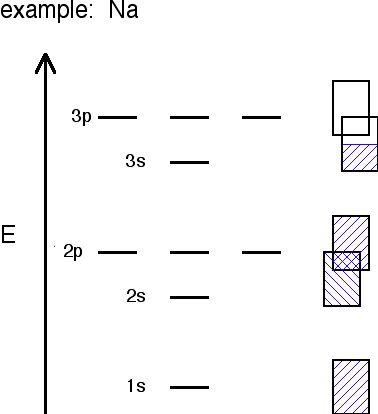
Sodium's bands are shown with the rectangles. Filled bands are colored in blue. As you can see, bands may overlap each other (the bands are shown askew to be able to tell the difference between different bands). The lowest unoccupied band is called the conduction band, and the highest occupied band is called the valence band.
Bands will follow a trend as you go across a period:
- In Na, the 3s band is 1/2 full.
- In Mg, the 3s band is full.
- In Al, the 3s band is full and the 3p ban is 1/2 full... and so on.
The probability of finding an electron in the conduction band is shown by the equation:

The ∆E in the equation stands for the change in energy or energy gap. t stands for the temperature, and R is a bonding constant. That equation and this table below show how the bigger difference in energy is, or gap, between the valence band and the conduction band, the less likely electrons are to be found in the conduction band. This is because they cannot be excited enough to make the jump up to the conduction band.
| ELEMENT |
∆E(kJ/mol) of energy gap |
# of electrons/cm^3 in conduction band |
insulator, or conductor? |
| C (diamond) |
524 (big band gap) |
10-27 |
insulator |
| Si |
117 (smaller band gap, but not a full conductor) |
109 |
semiconductor |
| Ge |
66 (smaller band gap, but still not a full conductor) |
1013 |
semiconductor |
 الاكثر قراءة في مواضيع عامة في الكيمياء اللاعضوية
 اخر الاخبار
اخبار العتبة العباسية المقدسة


