آخر المواضيع المضافة

 تاريخ الرياضيات
الرياضيات في الحضارات المختلفة
الرياضيات المتقطعة
الجبر
الهندسة
المعادلات التفاضلية و التكاملية
التحليل
علماء الرياضيات
تاريخ الرياضيات
الرياضيات في الحضارات المختلفة
الرياضيات المتقطعة
الجبر
الهندسة
المعادلات التفاضلية و التكاملية
التحليل
علماء الرياضيات | Frequency Distribution |


|
|
Read More
Date: 10-4-2021
Date: 24-4-2021
Date: 24-3-2021
|
The tabulation of raw data obtained by dividing it into classes of some size and computing the number of data elements (or their fraction out of the total) falling within each pair of class boundaries. The following table shows the frequency distribution of the data set illustrated by the histogram below.
| class interval | class mark | absolute frequency | relative frequency | cumulative absolute frequency | relative cumulative frequency |
| 0.00- 9.99 | 5 | 1 | 0.01 | 1 | 0.01 |
| 10.00-19.99 | 15 | 3 | 0.03 | 4 | 0.04 |
| 20.00-29.99 | 25 | 8 | 0.08 | 12 | 0.12 |
| 30.00-39.99 | 35 | 18 | 0.18 | 30 | 0.30 |
| 40.00-49.99 | 45 | 24 | 0.24 | 54 | 0.54 |
| 50.00-59.99 | 55 | 22 | 0.22 | 76 | 0.76 |
| 60.00-69.99 | 65 | 15 | 0.15 | 91 | 0.91 |
| 70.00-79.99 | 75 | 8 | 0.08 | 99 | 0.99 |
| 80.00-89.99 | 85 | 0 | 0.00 | 99 | 0.99 |
| 90.00-99.99 | 95 | 1 | 0.01 | 100 | 1.00 |
REFERENCES:
Kenney, J. F. and Keeping, E. S. "Frequency Distributions." §1.8 in Mathematics of Statistics, Pt. 1, 3rd ed. Princeton, NJ: Van Nostrand, pp. 12-19, 1962.

|
|
|
|
التوتر والسرطان.. علماء يحذرون من "صلة خطيرة"
|
|
|
|
|
|
|
مرآة السيارة: مدى دقة عكسها للصورة الصحيحة
|
|
|
|
|
|
|
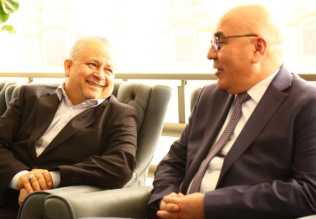
نحو شراكة وطنية متكاملة.. الأمين العام للعتبة الحسينية يبحث مع وكيل وزارة الخارجية آفاق التعاون المؤسسي
|
|
|